

Opinionated, canvas-rendered charts for trading and financial-data visualization.
React and Solid adapters share one framework-agnostic core, powered by a Rust engine compiled to WASM.
Built for fast, smooth rendering on mid-tier devices.
@abdullahjaswal/tickyr-charts-react · @abdullahjaswal/tickyr-charts-solid
Every example is rendered live from the library. Theme (light / dark), color scheme (Monochrome / Classic / Accessible), and visual style (Fill / Outline) are all switchable at runtime. The shots below use the Outline style.
CandleChart, across themes and color schemes:
| Monochrome | Classic | |
|---|---|---|
| Light | 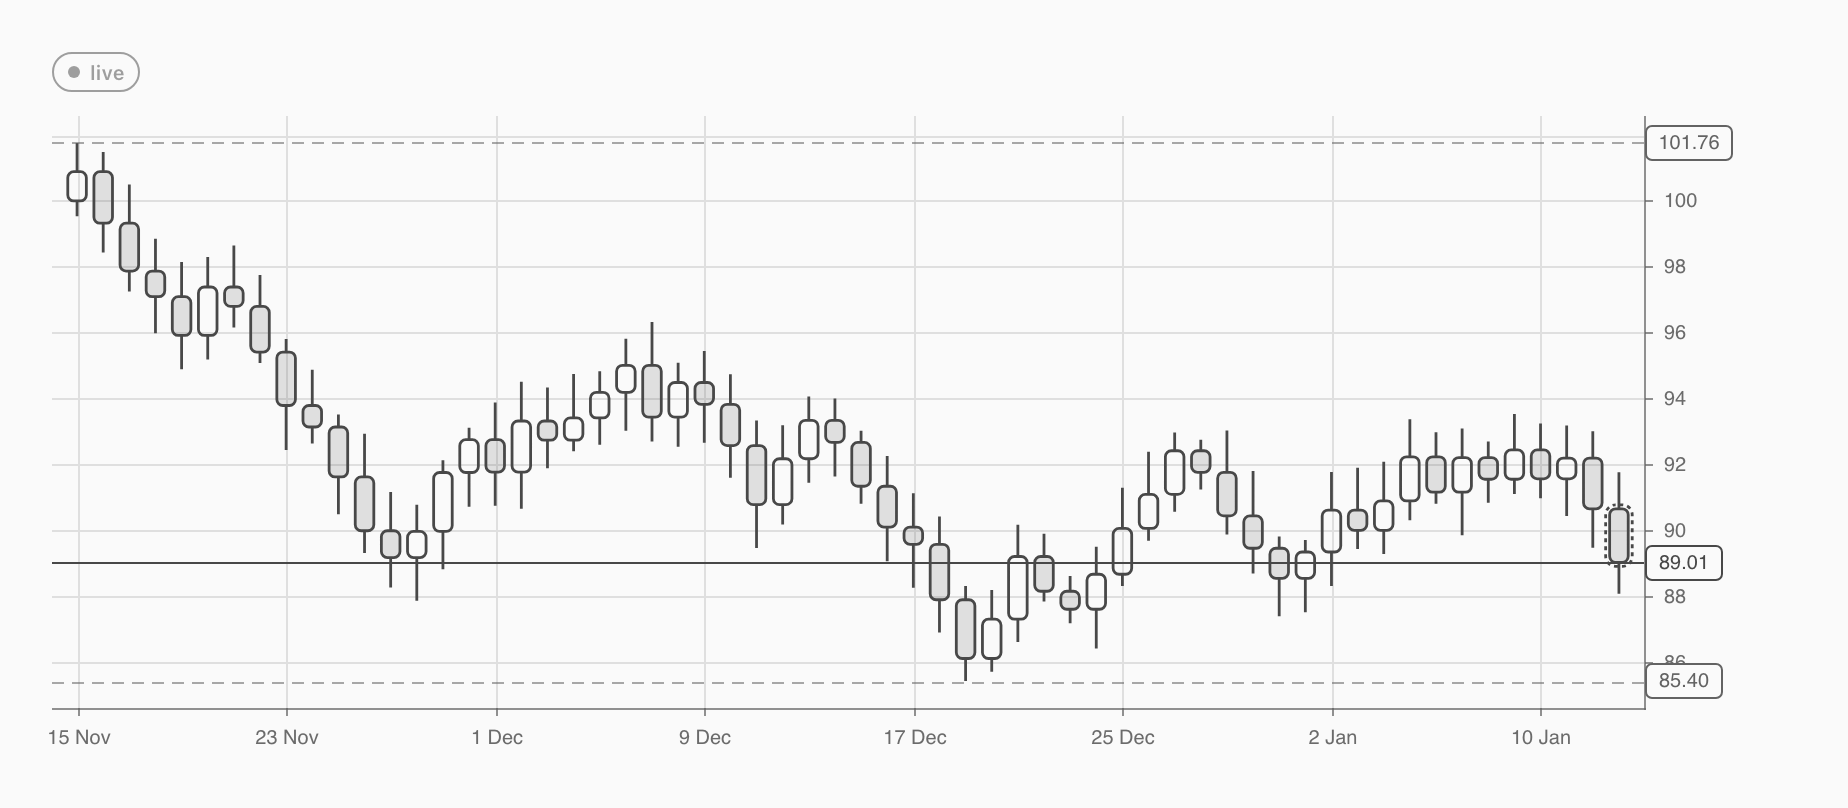 |
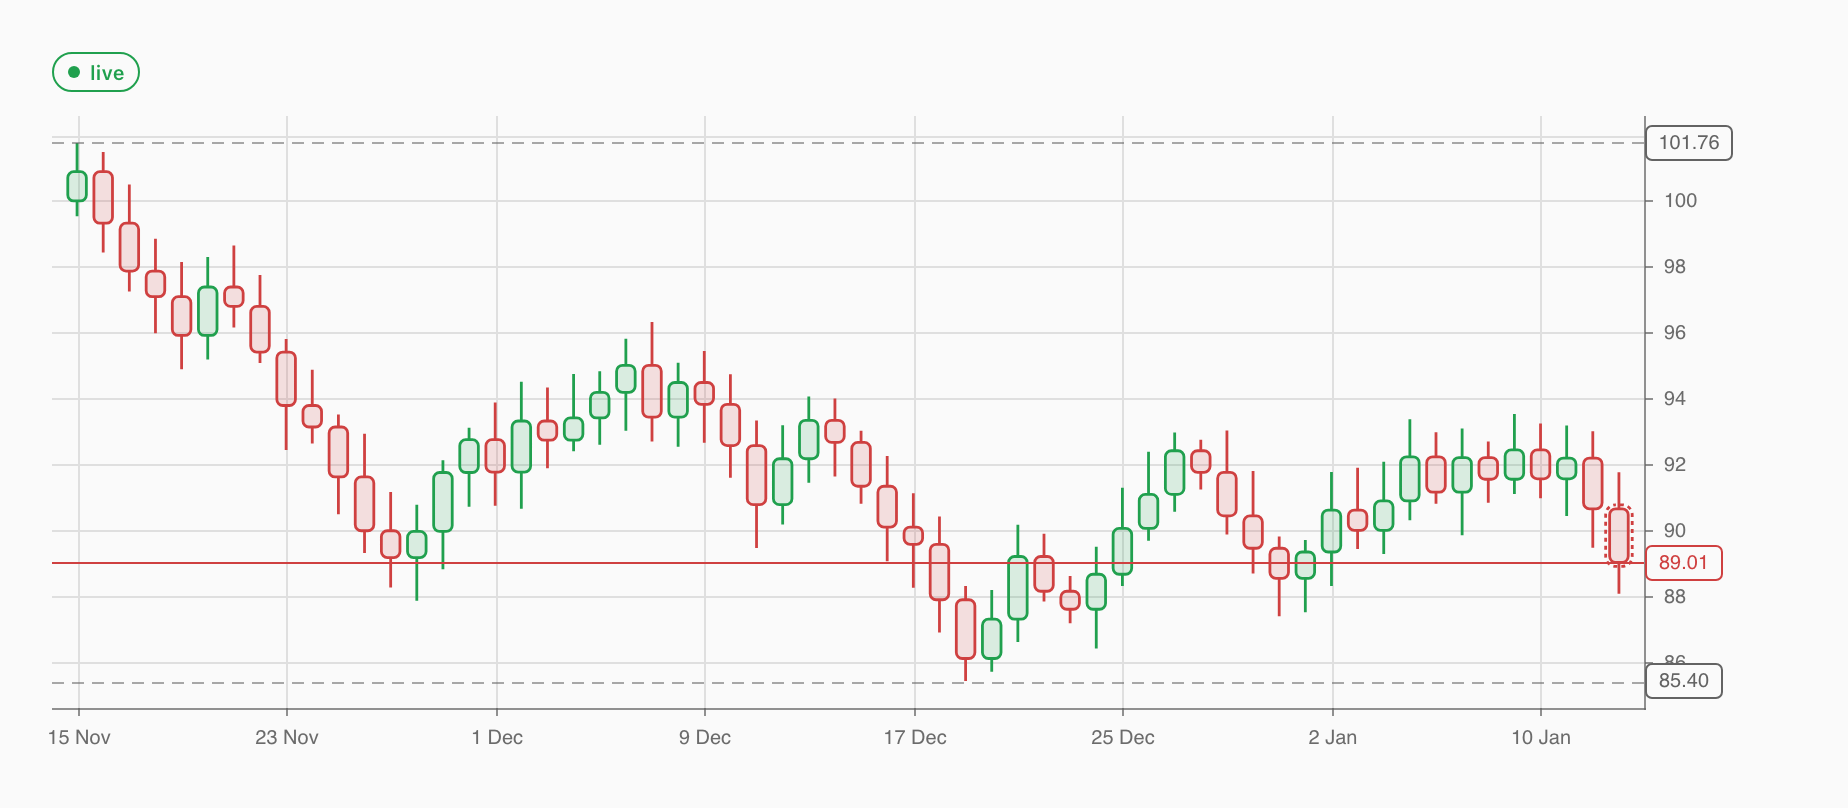 |
| Dark | 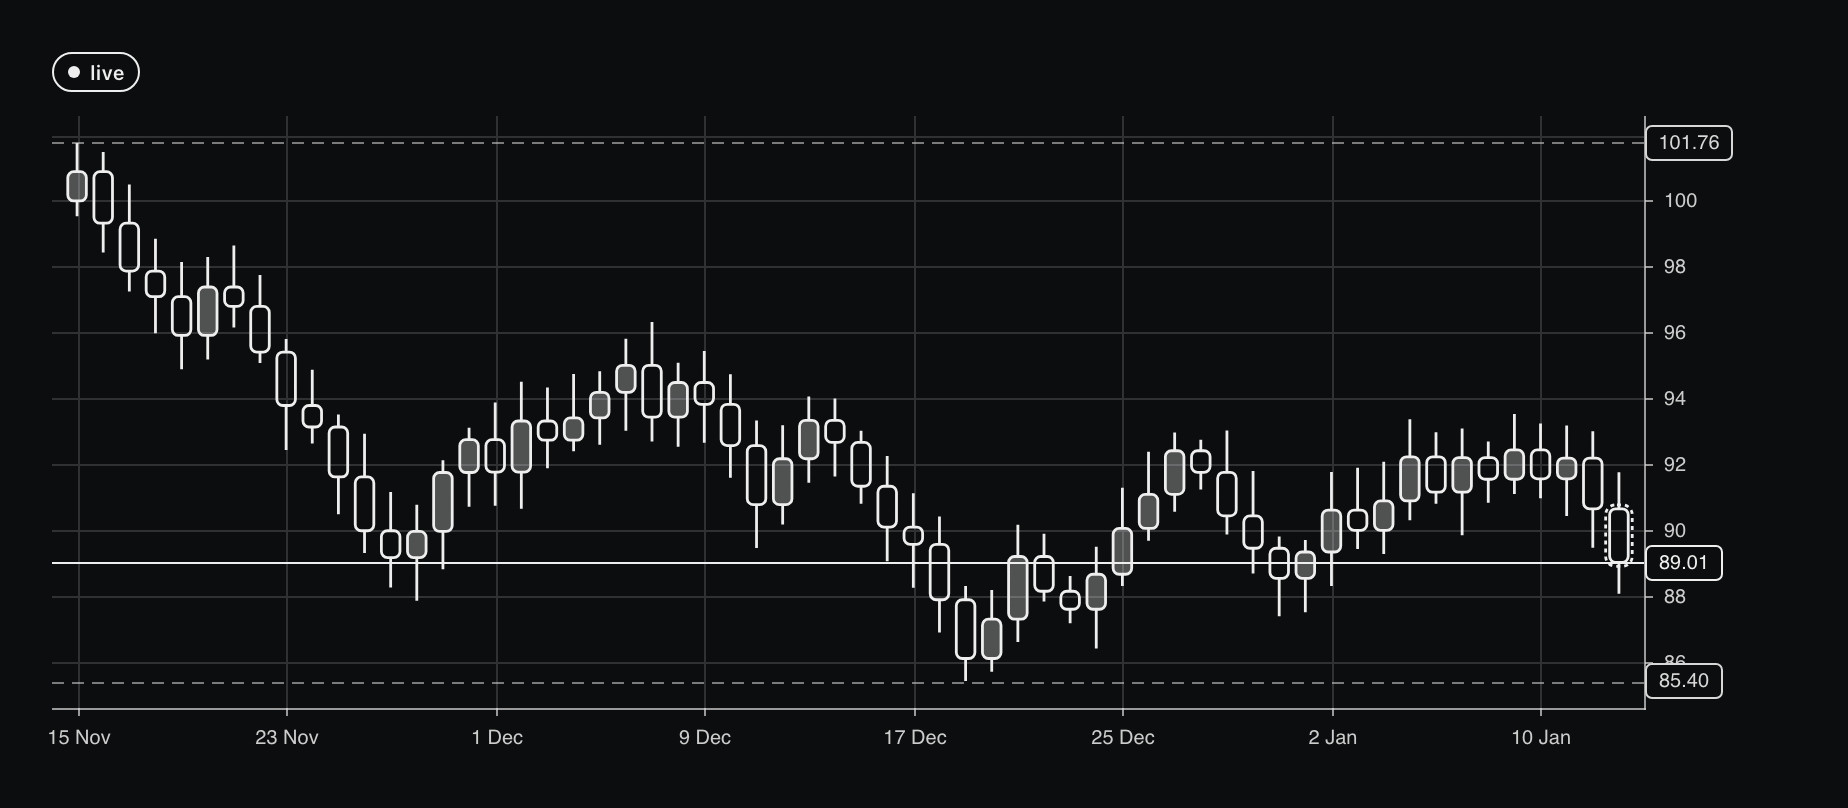 |
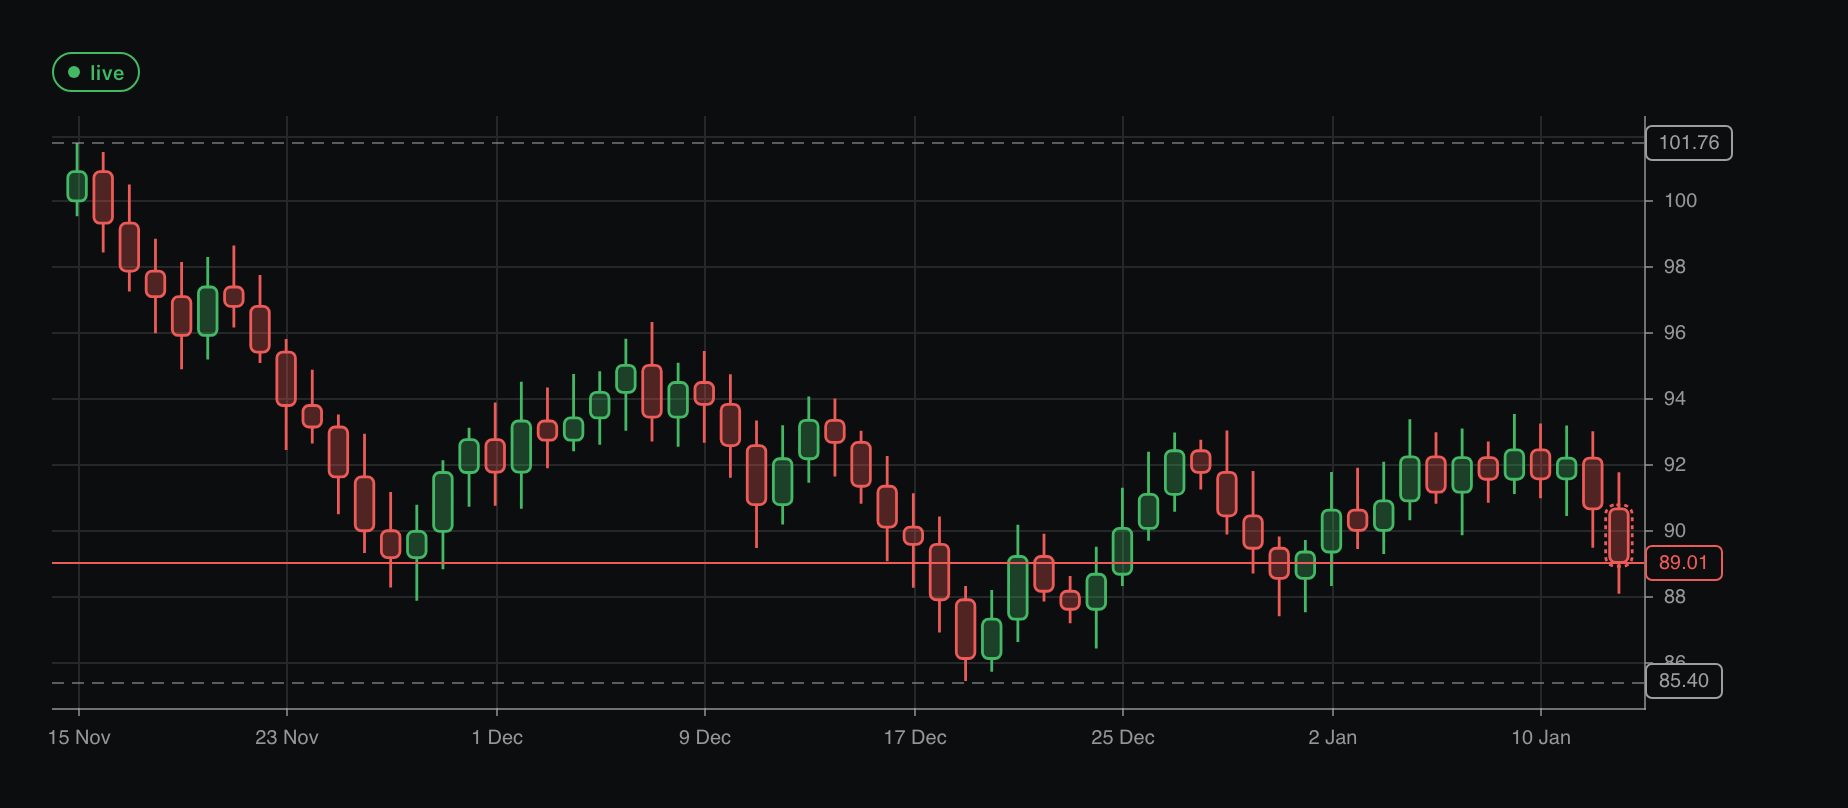 |
More chart types:
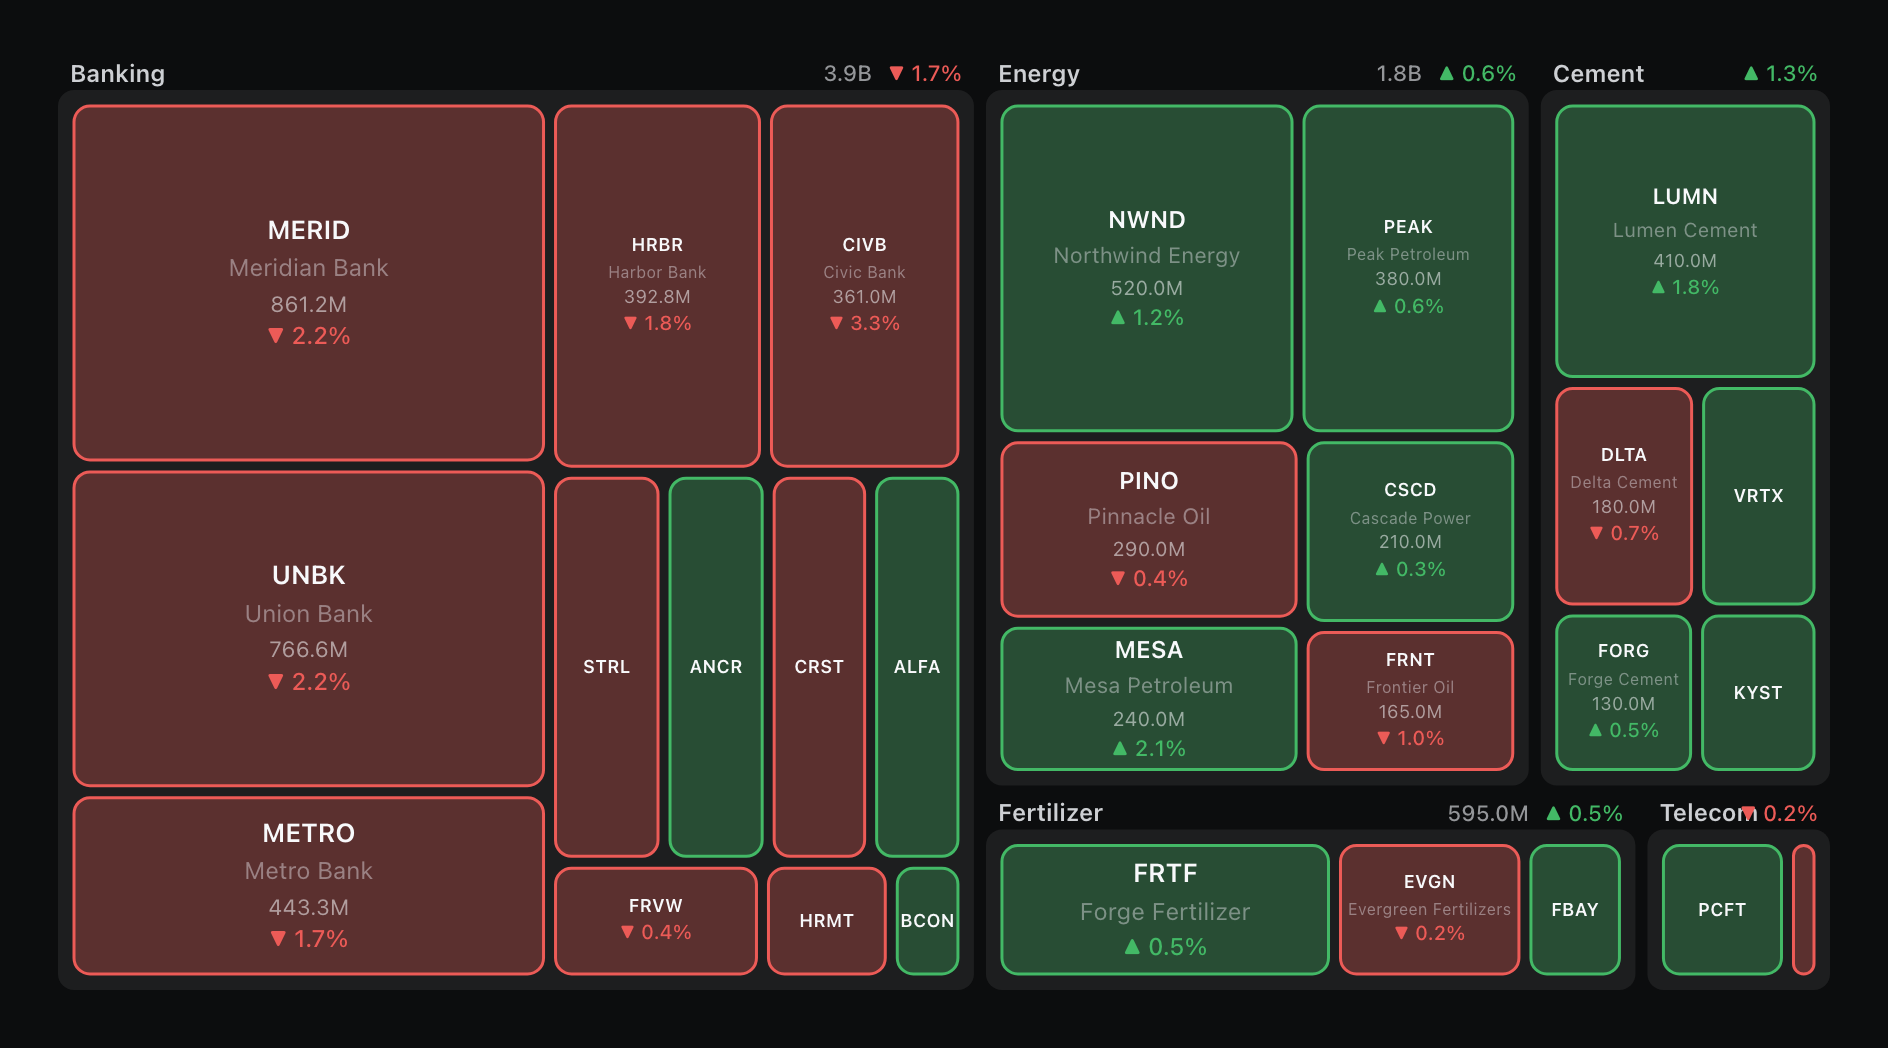 TreemapChart, dark, Classic |
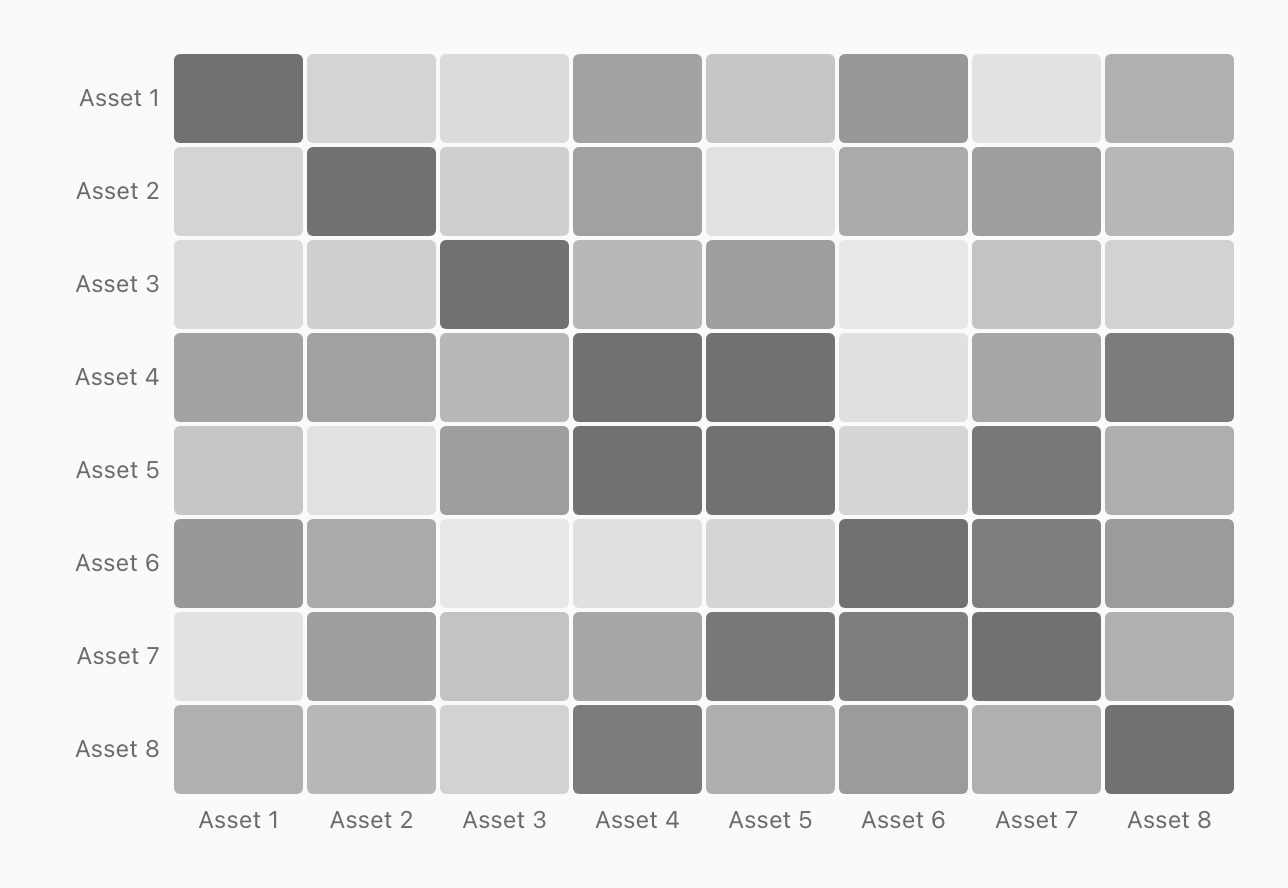 HeatmapChart, light, Monochrome |
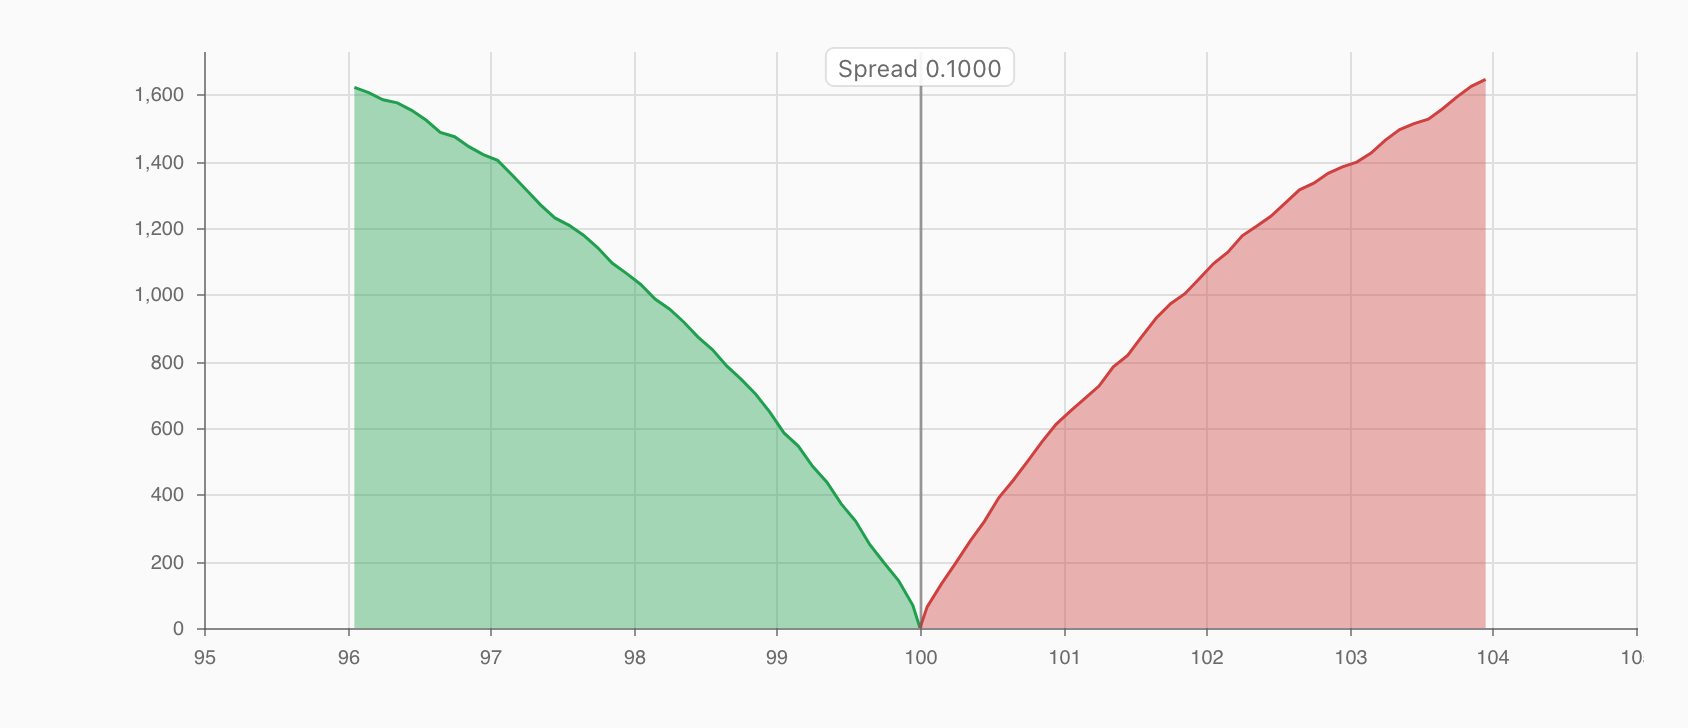 DepthChart, light, Classic |
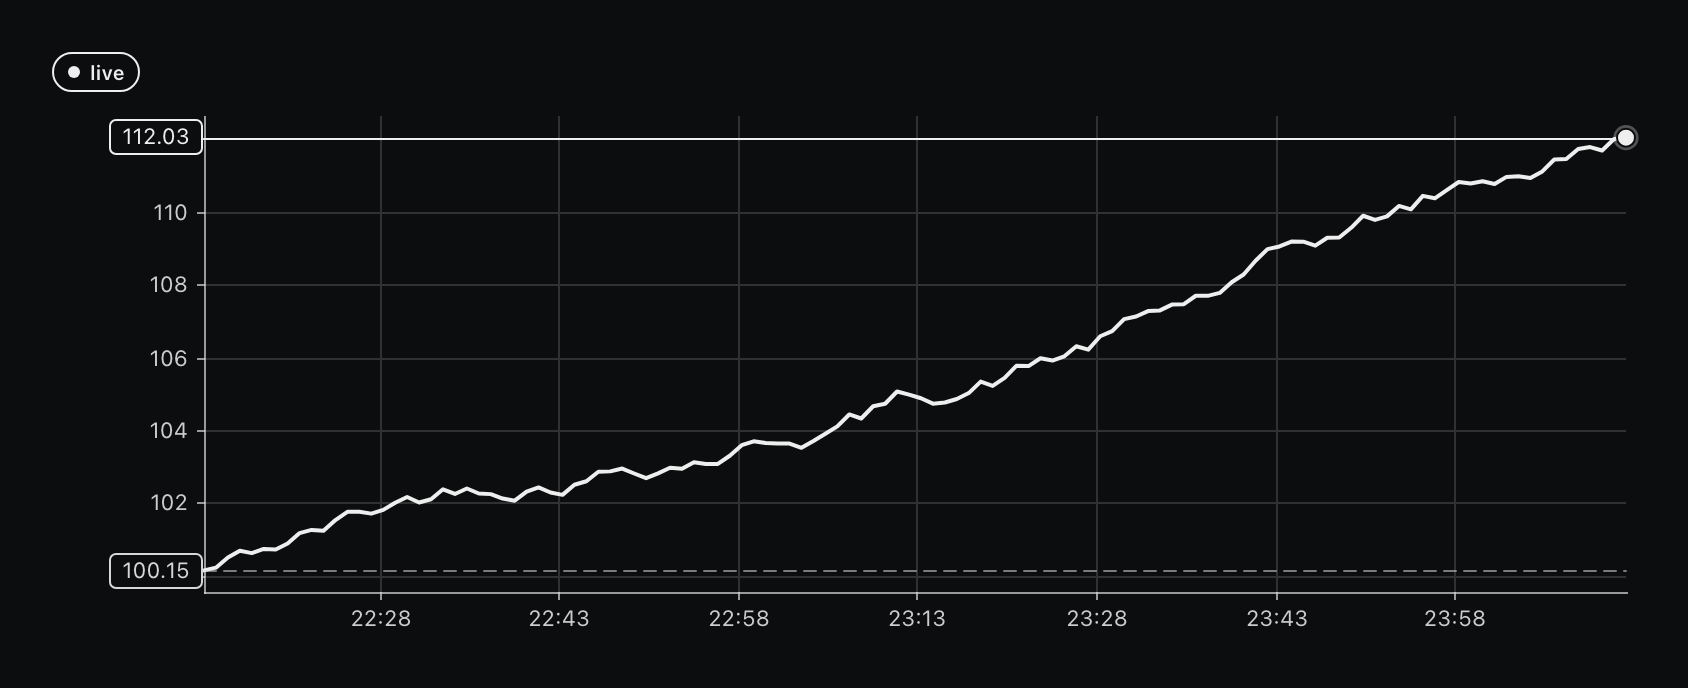 LineChart, dark, Monochrome |
| Chart | What it's for |
|---|---|
| CandleChart | OHLC candles with volume sub-pane, indicators (RSI / MACD / Stochastic / ATR), VWAP overlay, signal / order / event / position markers, drawing tools, comparison overlay |
| LineChart | Time-series line - multi-series, indicator overlays (SMA / EMA / WMA / Bollinger), curve interpolation (linear / monotone / step / bump / basis) |
| AreaChart | Filled line with optional baseline, threshold-split colors, and gradient fills |
| BarChart | Vertical or horizontal bars - grouped / stacked / 100%-normalized / overlapping |
| ScatterChart | XY points with regression line + density-heatmap fallback for dense data |
| HistogramChart | Distribution bins - freedman-diaconis / sturges / fixed-count algorithms |
| HeatmapChart | Matrix heatmap with diverging / sequential / categorical color scales |
| PieChart / DonutChart | Categorical share-of-total with optional donut hole + center label |
| SunburstChart / TreemapChart | Hierarchical part-to-whole with drill-down navigation |
| SankeyChart | Flow diagrams across multiple stages |
| DepthChart | Orderbook bid/ask depth with mid-line + spread display |
| RenkoChart / KagiChart / PointFigureChart | Price-only "filtered-time" charts that ignore the time axis |
- 🌐 Locale- and session-aware - exchange session-aware time axis collapses overnight/weekend gaps;
lakh-croreand Western digit grouping; multi-currency formatting - 🌗 Themes + palettes - light, dark, and OS-tracking modes; built-in
Monochrome/Classic/Accessible(CVD-safe) palettes; register your own - 🎨 Personalization - every visual axis (corner radius, border width, glow, patterns, animations) configurable at provider or per-chart level
- ♿ Accessible by default -
aria-labelon every chart, reduced-motion support, color-blind augmentation, keyboard-friendly drawings - 📡 Streaming-first - primitive-arg
chart.onTick(time, price, size)API; engine-validated aggregation with bucket transitions, anomaly detection, and audit/telemetry hooks - ⚡ Fast - 60fps target on mid-tier 2022 Android devices; sustained 10+ ticks/sec; 8-10 charts concurrent
Separate, self-contained packages per framework - install the one you use:
# React
bun add @abdullahjaswal/tickyr-charts-react react react-dom

# Solid
bun add @abdullahjaswal/tickyr-charts-solid solid-js
react / react-dom (React) and solid-js (Solid) are peer dependencies. Each package bundles the shared core + WASM engine, so there's nothing else to install.
import { ChartsProvider, CandleChart } from "@abdullahjaswal/tickyr-charts-react"

export default function App() {
  return (
    <ChartsProvider theme="dark" palette="Monochrome">
      <CandleChart
        data={{ candles: ohlcBars }}
        width={900}
        height={400}
        indicators={[{ type: "rsi", period: 14 }]}
        vwap={{ visible: true }}
      />
    </ChartsProvider>
  )
}import { ChartsProvider, CandleChart } from "@abdullahjaswal/tickyr-charts-solid"
function App() {
return (
<ChartsProvider theme="dark" palette="Monochrome">
<CandleChart
data={{ candles: ohlcBars }}
width={900}
height={400}
/>
</ChartsProvider>
)
}import { useRef } from "react"
import { CandleChart, type CandleChartHandle } from "@abdullahjaswal/tickyr-charts-react"
const ref = useRef<CandleChartHandle>(null)
// Push ticks from your websocket - primitive args, no allocations.
socket.on("tick", (t, price, size) => {
ref.current?.onTick(t, price, size)
})
return <CandleChart ref={ref} data={initialBars} streaming={{
timeframeMinutes: 1,
market: "equity",
}} />The ChartsProvider wires shared defaults that every chart inherits (theme, palette, locale, time zone, visual style, etc.). Individual charts override per prop.
<ChartsProvider
  theme="inherit"             // "light" / "dark" / "inherit" (follows OS)
  palette="Monochrome"        // or "Classic", "Accessible", or your own
  locale="USA"
  timeZone="America/New_York"
  visualStyle="Fill"          // or "Outline"
  cornerRadius={3}
  borderWidth={1.4}
  accents={false}
>
  {/* charts */}
</ChartsProvider>
Every chart accepts the same core props on top of its specific ones - see the Storybook docs (below) for the full prop table per chart.
Interactive component docs with live examples and prop tables:
bun run storybook # http://localhost:6006Or build the static site:
bun run build:storybook # outputs storybook-static/Each chart has a Docs tab with:
- Every prop, its type, default, and description
- Every story rendered live with interactive controls
- Theme + palette toggle for quick visual checks
Chrome ≥ 111 Edge ≥ 111 Firefox ≥ 128 Safari ≥ 16.4
Matches a mid-tier device floor.
For hosts that prefer a hook-driven setup:
import { useStreamingCandles } from "@abdullahjaswal/tickyr-charts-react"

const { candles, pushTick, ready } = useStreamingCandles({
  timeframeMinutes: 1,
  market: "equity",
  minPriceRaw: 0,
  maxPriceRaw: 1_000_000_00,    // scaled-integer cents
  maxVolumeRaw: 1_000_000_000,
})

return <CandleChart data={candles} />
The hook owns the streaming engine + pre-allocated bar buffer. Each pushTick validates + aggregates + emits a fresh snapshot.
@abdullahjaswal/tickyr-charts-react    → React adapter (core + WASM engine bundled in)
@abdullahjaswal/tickyr-charts-solid    → Solid adapter (core + WASM engine bundled in)
Both adapters render the same canvas pixels - switch freely between them in the same codebase.
Proprietary. All rights reserved. See LICENSE.