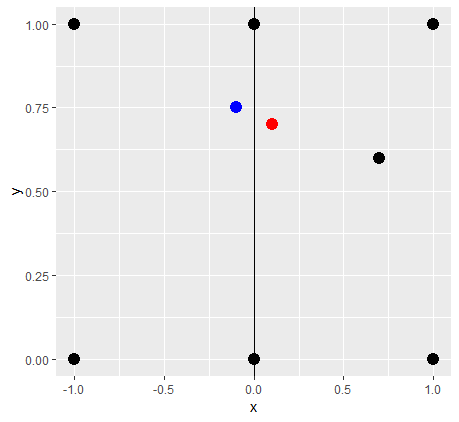
 ```r data.table(x = c(-1, -1, 0, 0, -0.1, 0.1, 0.7, 1, 1), y = c(0, 1, 0, 1, 0.75, 0.7, 0.6, 0, 1)) %>% .[, color := "black"] %>% .[x == -0.1, color := "blue"] %>% .[x == 0.1, color := "red"] %>% ggplot(aes(x, y, color = color)) + scale_color_identity() + geom_point(size = 4) + annotate("segment", y = -Inf, yend = Inf, x = 0, xend = 0) ```


